Physiological signals & flight performance
Which physiological signals best explain whether a student pilot flies the exercises successfully, so trainers can give more targeted guidance?
- CSV files cleaned and merged~360
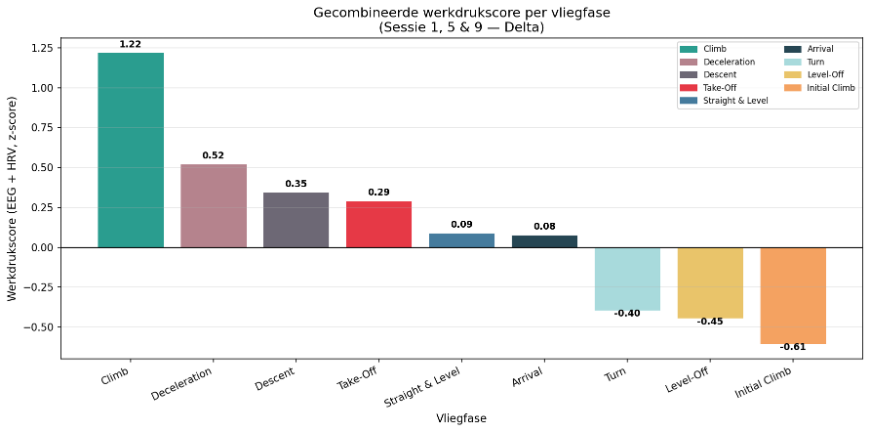
- workload score in Climb, the highest phase+1.22
- pupil size vs altitude error (session 5)r = 0.55
- Random Forest on test dataR² 0.43
Making 360 files usable
Six student pilots, callsigns Alpha to Foxtrot, were measured during ten training sessions. Every session produced six CSV exports per pilot, each from a different source and with its own timestamps and columns.
Before any analysis could start, we linked all sessions per pilot onto one timeline and checked missing values, column names and data types. Sessions 1, 5 and 9 became the basis for the EEG and precision analyses; all ten sessions fed the heart-rate trends.
10 sessions times 6 pilots times 6 files makes about 360 CSV files.
Per pilot, per session: Aurora, Data, EEG, Event-List, Features, HR
Making signals comparable
Raw sensor values sit on different scales, so we standardised them as z-scores. From two brain-wave bands we then built one workload score, beta_z − alpha_z: positive means a phase is relatively demanding, negative relatively relaxed.
Applied to pilot Delta’s sessions 1, 5 and 9, the score made one phase stand out. We had expected Take-Off to be the heaviest, but it came in at +0.29, behind Deceleration (+0.52) and Descent (+0.35).
Climb scored +1.22: clearly the most demanding phase of the flight.
Finding patterns
With comparable signals we looked for structure in several ways. K-means on EEG and heart rate separated three physiological states — high mental activity, a low-activity baseline and high arousal/focus — and in the correlation matrix beta and gamma moved together (0.76), as did delta and theta (0.66).
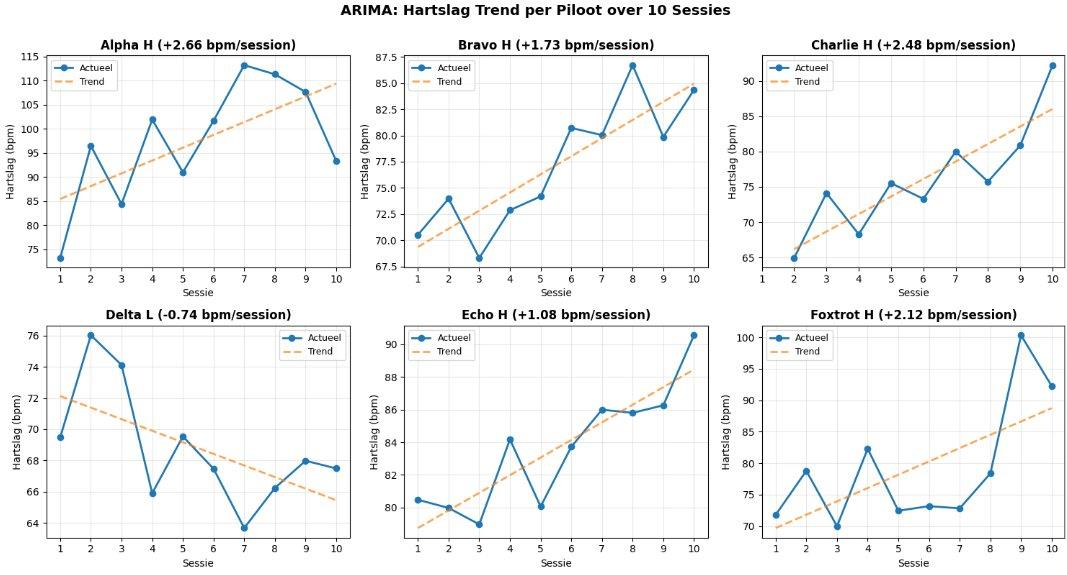
Over time, an ARIMA trend per pilot showed heart rate rising with training: Alpha +2.66, Charlie +2.48, Foxtrot +2.12, Bravo +1.73 and Echo +1.08 bpm per session, which may point to growing performance pressure. Higher beta and gamma activity also tended to go with better instructor ratings, but with this few sessions we treat that as an indication, not a cause.
Five of six pilots’ heart rate went up with experience; only Delta trended down (−0.74 bpm per session).
Predicting performance
Finally we asked the question directly. In stable flight phases we correlated pupil size, blink rate and heart rate with altitude and speed error (Spearman). The strongest link was pupil size with altitude error, r = 0.55 in session 5, but no single sensor explained the errors on its own.
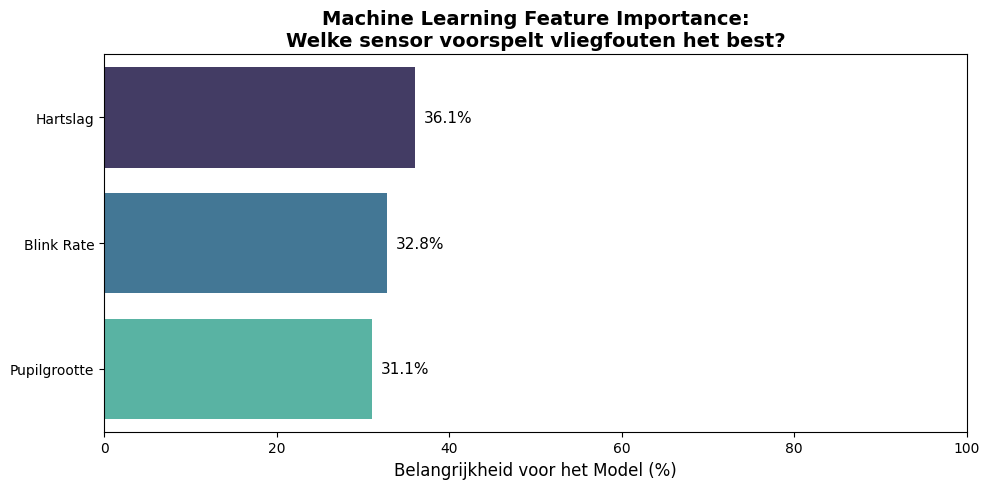
So we combined them: a Random Forest Regressor predicting altitude error from all three signals. Heart rate (36.1%), blink rate (32.8%) and pupil size (31.1%) contributed almost equally.
Together, the three signals explained 43% of the variance in altitude error (R² = 0.43 on test data).
Looking back
Because this is data about real people, we tried to handle it with care. A calculated or filled-in value should never pass for a real measurement (that is the GDPR accuracy principle), gaps should only be filled when there is no other way, and a model like ours should never be the one that judges a pilot. That call stays with the trainer.
We also know where our results stop. Ten sessions with six pilots is not a lot, the recordings had gaps and sensor noise, several analyses leaned on sessions 1, 5 and 9, and our first analysis did not have hard validation metrics yet. So we see what we found as a good starting point, not a final answer.
If NLR takes this further, our advice is to automate the cleaning and merging, keep original and filled-in values clearly apart, and look at the data per flight phase in dashboards. Checking the findings with trainers and collecting more sessions should come before anyone trusts a prediction. Writing down the model settings, such as the number of clusters and the ARIMA parameters, and making an ethics check a fixed step would make the work easier to repeat and build on.